
See fit. Detect value shifts. Move before the market does.
- The hassle, before AI
Fragmented data. Guesswork. Slow decisions.
Sector labels, not structure
- Founders build long investor lists and guess who is aligned.
- Investors rely on inbound deal flow and obvious consensus themes.
- Governments see who is active in a sector, but not what's missing.
- Insight lives in disconnected datasets, reports, and interviews.
Structured, explainable fit
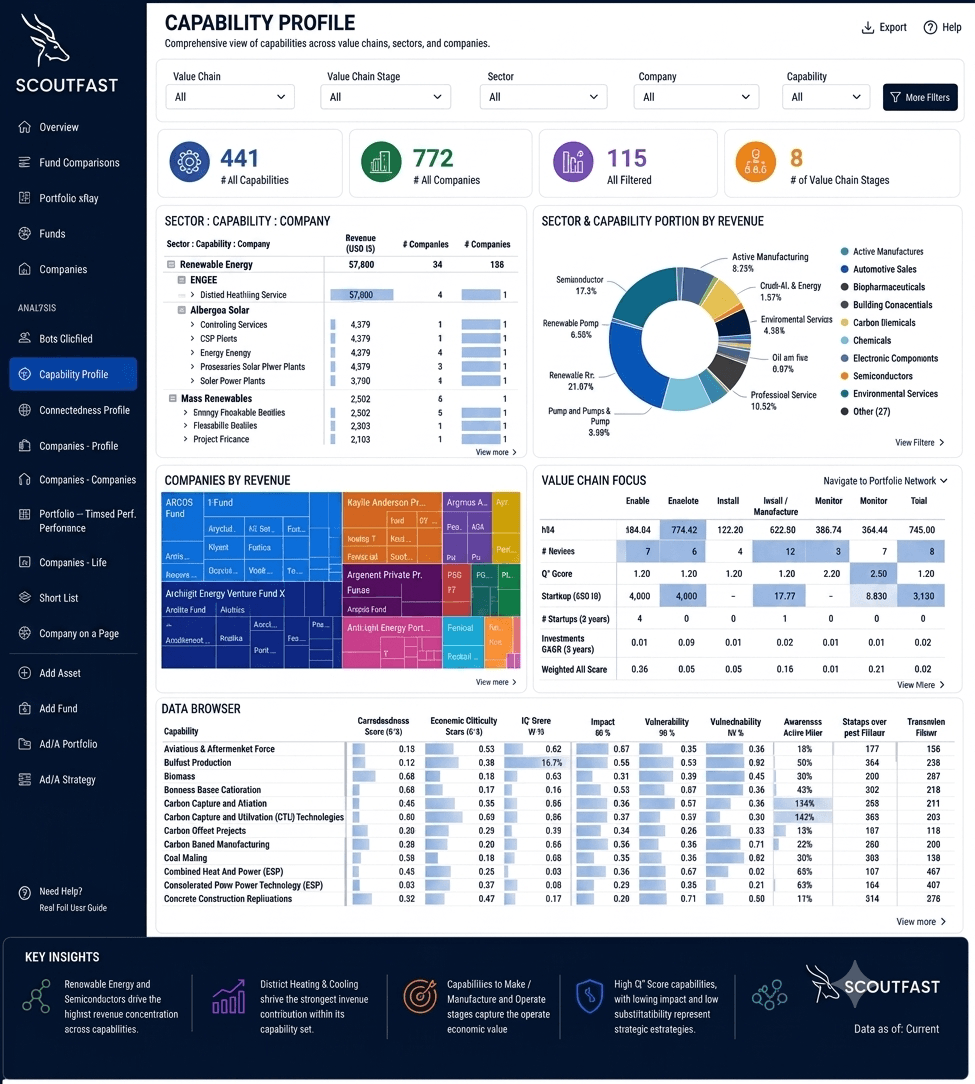
- See the capabilities underneath a company, portfolio, or sector.
- Understand why fit exists — and what's missing.
- Spot bottlenecks, adjacencies, and value shifts early.
- Move from performance reporting to decision-ready intelligence.
- Shared framework
One foundation. Different decisions.
01
Map capabilities
Identify the capabilities shaping a company, investment thesis, sector, or ecosystem.
02
Connect actors & capital
Show how companies, investors, institutions, infrastructure, and market signals connect.
03
Identify fit & gaps
Use graph-based intelligence to surface strategic fit, bottlenecks, and emerging opportunity.
04
Deliver explainable outputs
Translate analysis into reports, dashboards, maps, rankings, and decision-support insights.
- Application 01 — SCOUTFAST
Find the right fit before spending time on the wrong conversation.
- Founder view
For founders
Who should we approach, why are they a fit, and how should we position ourselves?
- Which investors should we prioritise?
- Why might our company fit their thesis, portfolio, stage, or strategic interests?
- How are we positioned within our competitive and capability landscape?
- How should we tailor our fundraising narrative?
- Fund view
For investors & funds
What fits our thesis, what is missing from our portfolio, and where is value likely to move?
- Which companies fit our investment thesis — and why?
- What capabilities are concentrated, missing, or underdeveloped across our portfolio?
- Where are new capability clusters, dependencies, or chokepoints emerging?
- Which opportunities sit outside conventional sector boundaries?
The Pivot Report
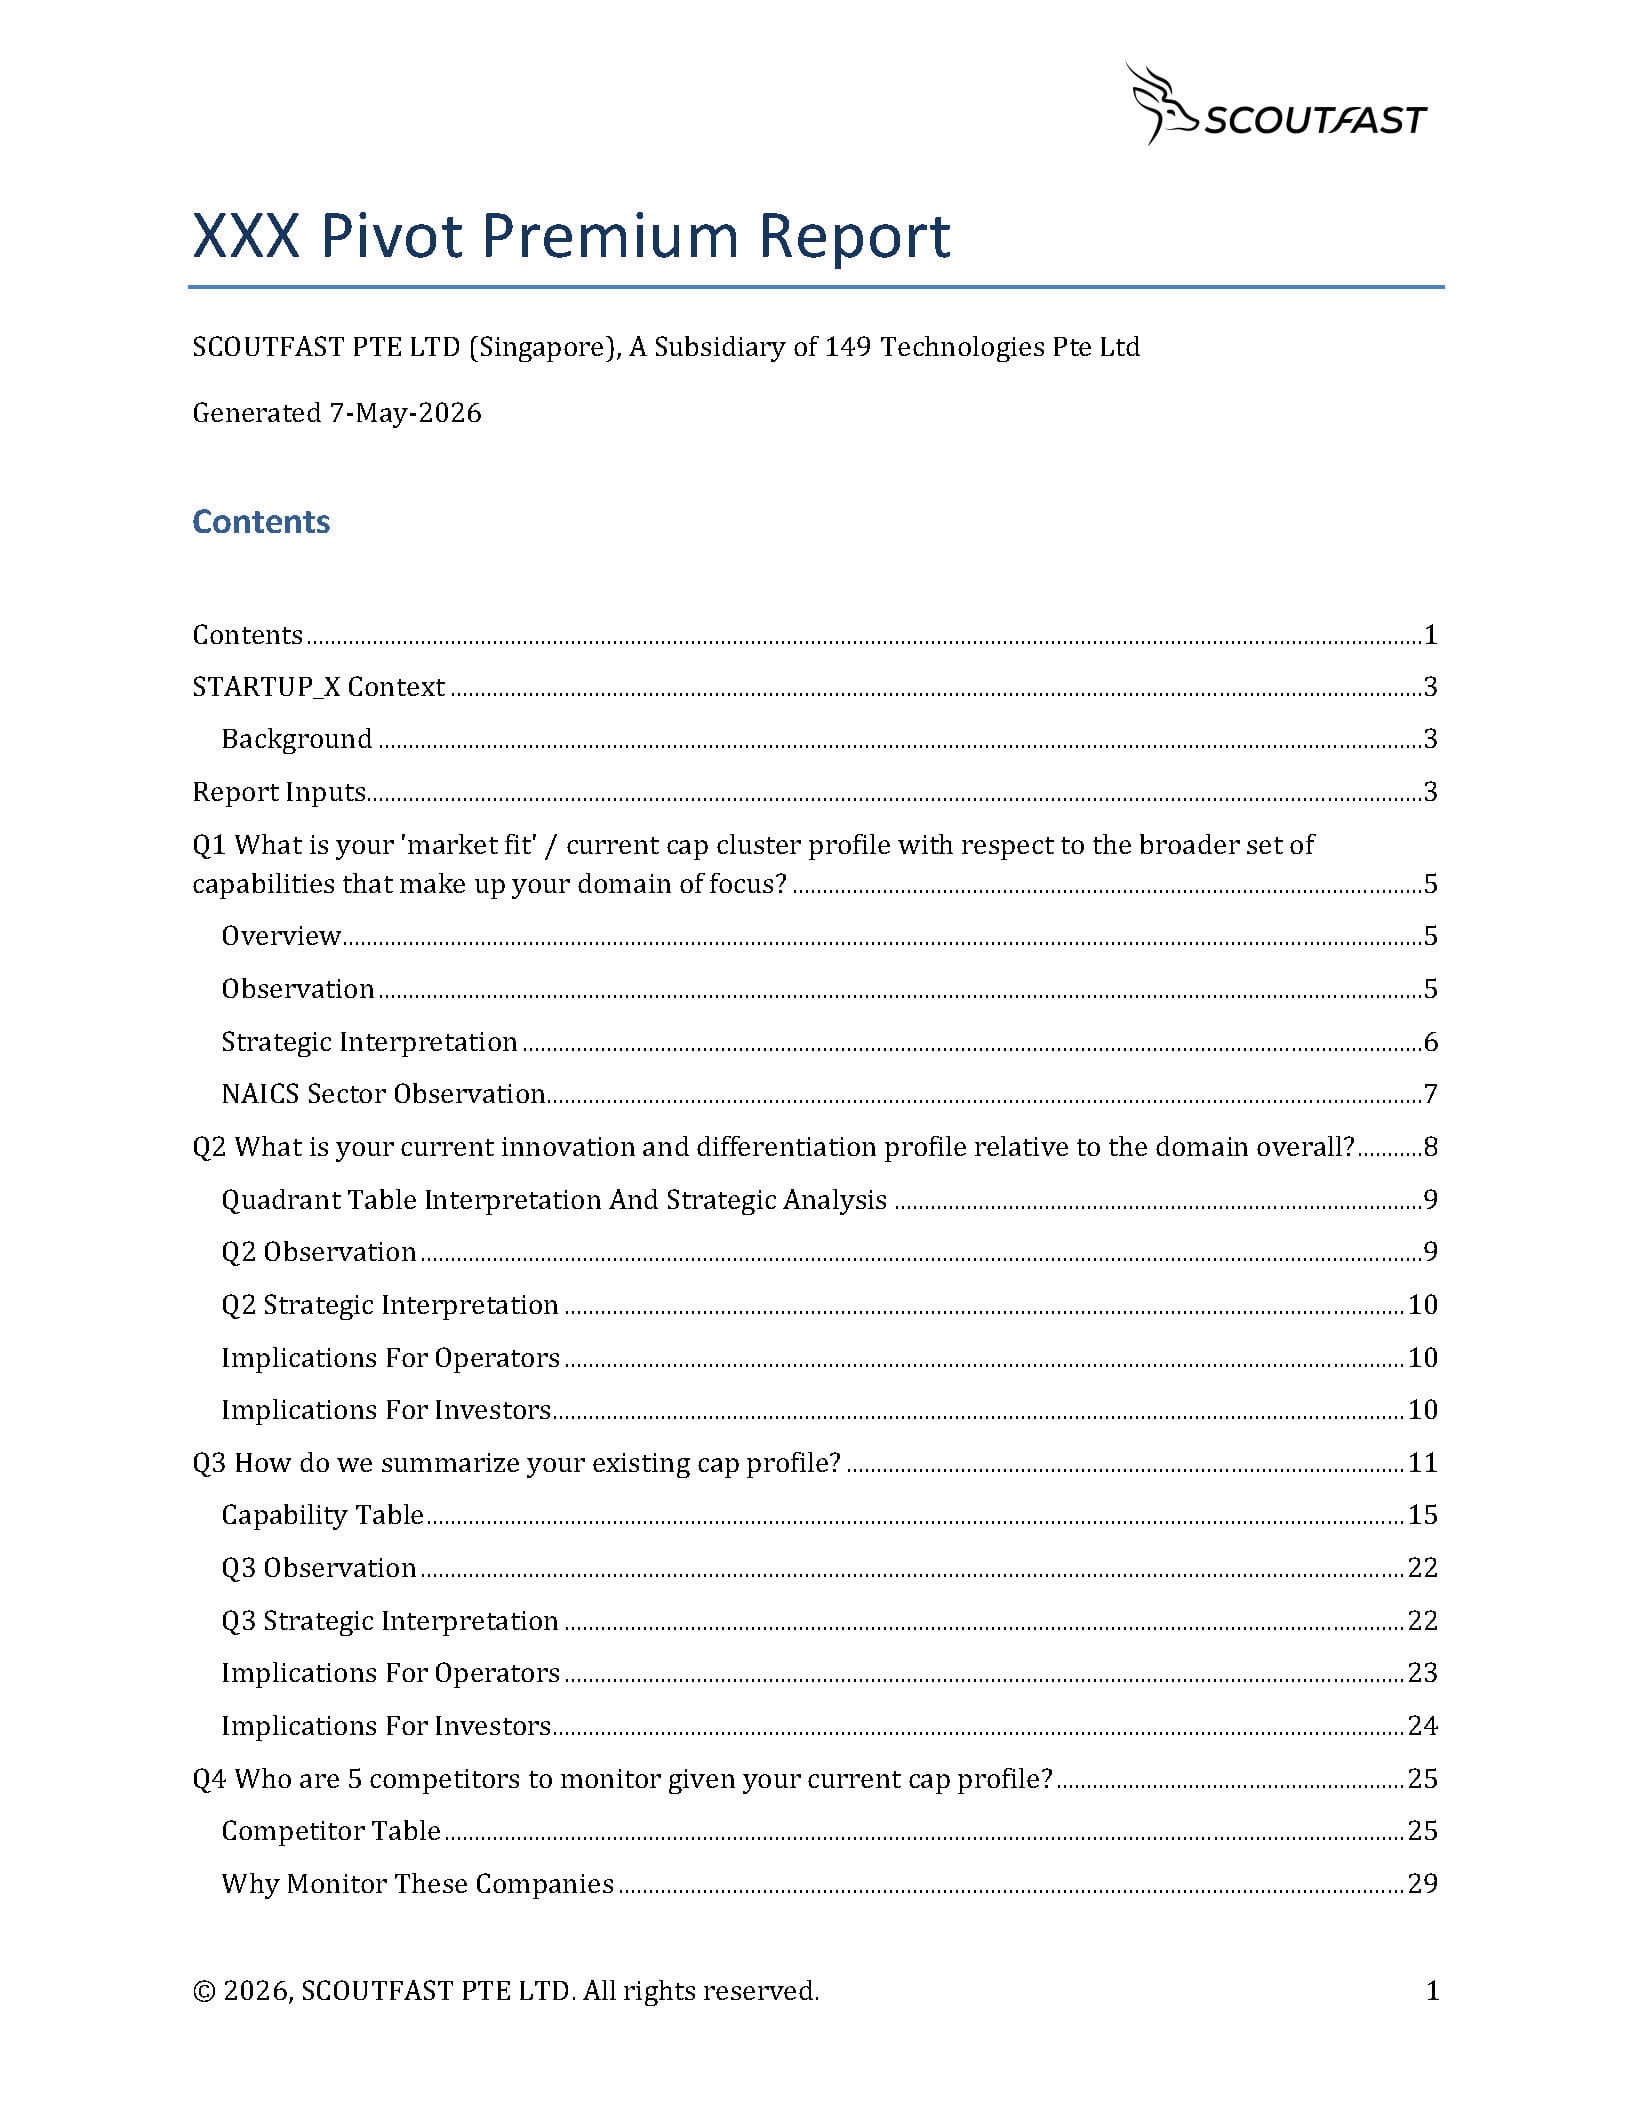
Founders receive a structured report that scores market fit against a live capability landscape — from cap cluster profile to a named shortlist of competitors to monitor.
- Current cap-cluster / market-fit profile
- Innovation & differentiation quadrant
- Five competitors to monitor, with FEVI scores
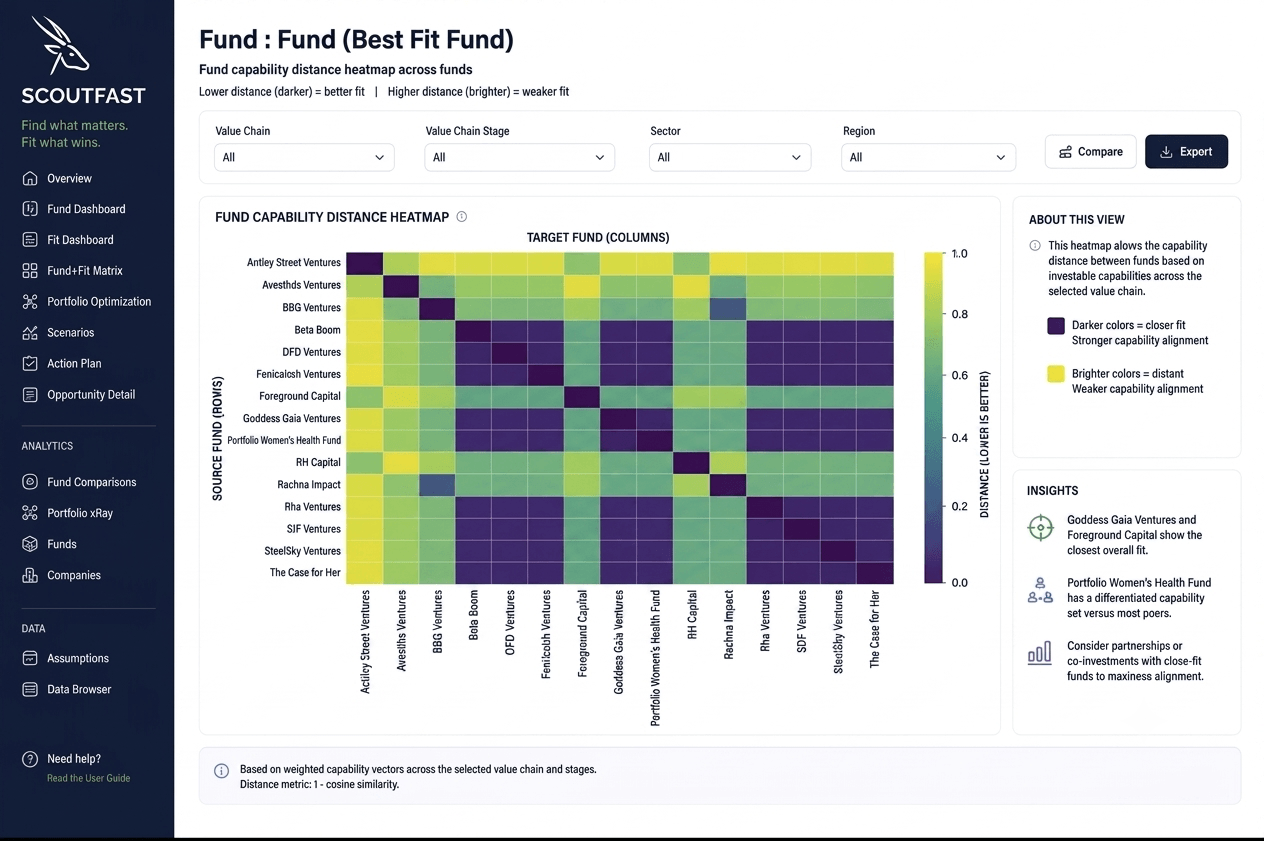
Portfolio X-Ray Dashboard
Funds get an algorithmic shortlist of candidates ranked by potential vs. current performance (FEVI), sortable by economic profile, forecasted value, quality of asset, risk, and sensitivity.
- Prioritise focus across a live shortlist
- De-construct portfolio companies into underlying capabilities
- Find “like” companies from a bottom-up and financial perspective
- Application 02 — ORYQ
See how an economy or sector is forming — not only how it performed.
- Government view
Governments & economic authorities
What is changing, what is constrained, and where can action create the greatest leverage?
- Which capabilities are essential to this sector or economic objective?
- Where are the critical dependencies, bottlenecks, and chokepoints?
- Where is capital flowing, and where is it not?
- Which decisions may create the greatest leverage?
- Ecosystem view
Ecosystem builders & institutional partners
What does this ecosystem have, what is missing, and what should we strengthen next?
- The capability profile of an ecosystem
- Underdeveloped or over-concentrated areas
- Connections between companies, investors, institutions, and infrastructure
- Opportunities for programme design and capital attraction
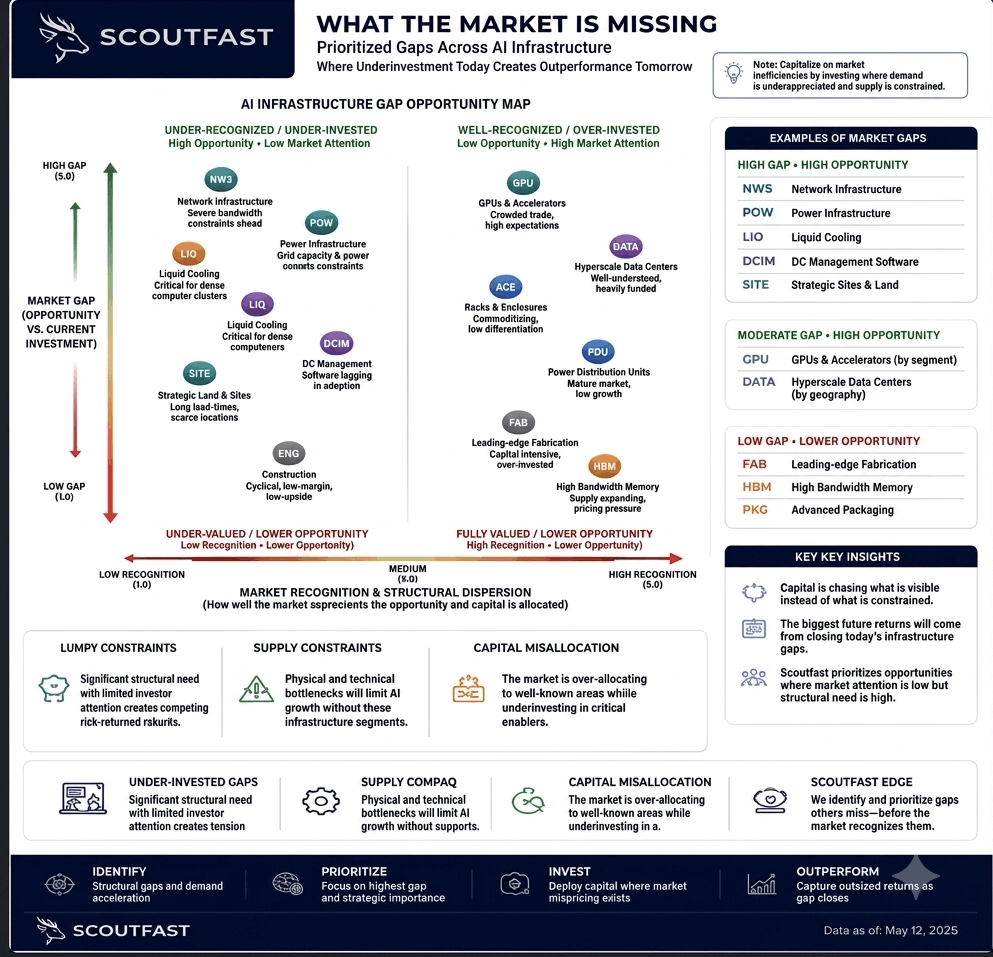
What the market is missing
A prioritized gap map plots market recognition against structural opportunity — surfacing where demand is underappreciated and supply is constrained, so capital can move before consensus catches up.
- Under-recognized, high-opportunity segments flagged first
- Supply constraints and capital misallocation made visible
- Built for recurring intelligence, not a one-off snapshot
Want to see what capability economics can reveal in your market?
Tell us what you are building, funding, mapping, or trying to understand.